For most of the new dashboards we build at Bluesquare, we no longer start from a business intelligence (BI) tool like Power BI, Tableau or Apache Superset. We write a small web app instead, with an AI coding assistant, on top of data that is already cleaned and modeled in OpenHEXA.
The reasoning is simple. A BI tool does two jobs: it models the data (tables, indicator definitions, access rules) and it renders the result (charts, maps, filters). The first job is where most of the engineering effort goes, and it doesn’t depend on the BI tool. The second job is now cheap to do in plain code. Once you separate the two, the rendering part can be a custom app.
Separating the data layer from the rendering layer is usually called headless BI, and the question of whether AI-built apps will replace BI dashboards has been debated a lot this year. This post describes how it works in practice on OpenHEXA, and why we think it matters for ministries of health that run their own infrastructure.
In OpenHEXA, the data work happens in a workspace. Pipelines are Python (and soon R) programs, written with the OpenHEXA SDK and scheduled in the platform. They pull data from DHIS2, IASO, surveys or files, clean it, compute indicators, and write the results to the workspace’s database.
Indicator logic lives in these pipelines: which denominator applies to vaccination coverage, which facilities count as reporting, how late reports are handled. This logic is written once, in versioned code, and notebooks, exports and web apps all read from the tables it produces. Versioning is built into OpenHEXA, so there’s no need for a separate platform.
Since version 5.0, OpenHEXA can host static web apps inside a workspace, next to the pipelines and the database that feed them. An app can stay private to the workspace or be published publicly.
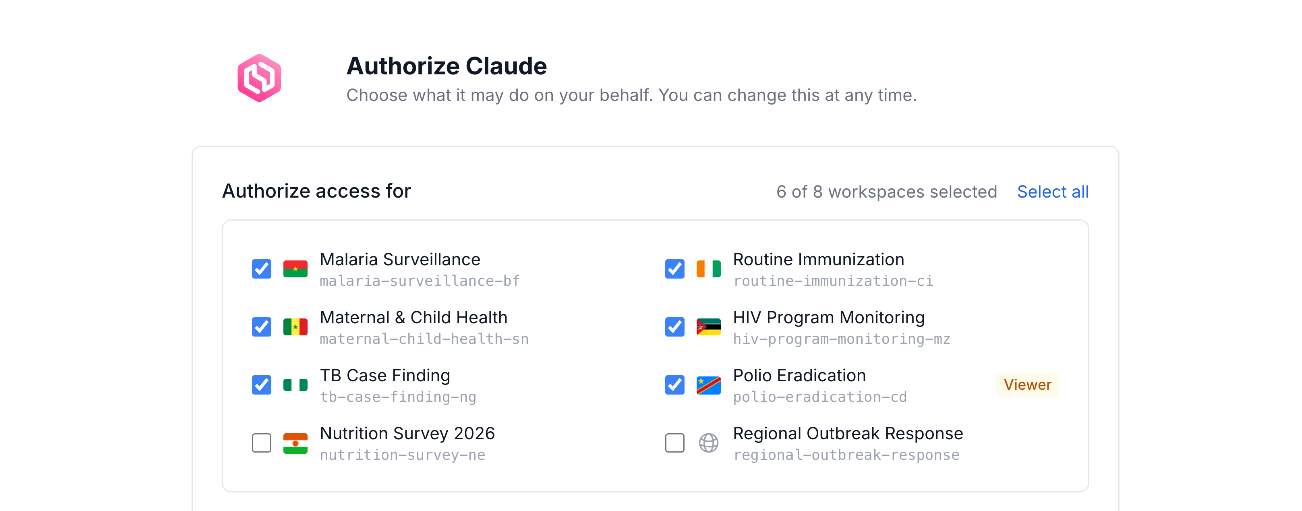
There are two ways to build them. OpenHEXA has an AI assistant directly in its interface: you describe the app or the change you want, and it writes the code, using the AI provider your organization has configured. Or you can use the AI agent you already work with, such as Claude, Codex or others, from your usual environment. OpenHEXA exposes a Model Context Protocol (MCP) server, so your agent can create and edit web apps in the workspace directly, with access to the same data and pipelines.
There are three practical gains compared to a BI dashboard:
A generated app should not be trusted with the database, and it doesn’t need to be. In OpenHEXA, a web app declares scopes (read datasets, read files, run pipelines, read the database, and so on), and its API calls go through a proxy that only lets through the fields those scopes allow.
For the database, the rule is stricter: a web app can only run queries that have been saved in the workspace. It can’t send SQL of its own. Every query is logged, including refused ones. So the saved queries act as the contract between the data layer and the app: the data team decides what can be read, and the app can only display it.
Access rules are managed in one place, with the data, and an app inherits them however it was written.
The usual objection to custom dashboards is maintenance: ten dashboards become ten small codebases. That was already true with BI dashboards. With web apps on OpenHEXA, the cost stays low, because the apps hold no business logic. Indicator definitions live in the pipelines, permissions live in the workspace, and the app only queries and draws.
When a definition changes, it changes once, in the pipeline. When an app becomes outdated, it’s often fixed in a couple of prompts.
Web apps are also versioned. Every change, whether it comes from the built-in assistant, an external agent or a developer, creates a new version with its author, message and diff. You choose which version is published. So trying a change is cheap: if the result isn’t good enough, you publish the previous version again.
OpenHEXA is open source and registered as a Digital Public Good. Ministries of health in the Democratic Republic of the Congo (DRC), Cameroon, Burkina Faso, Niger and Côte d’Ivoire use it, and it can be installed on a country’s own servers, so health data stays in national infrastructure. Once it runs on infrastructure you own, there are no recurring license fees tied to a credit card, and no price changes decided by a third-party vendor.
The installation is deliberately modest: a Debian package and a Docker Compose stack on a single Debian server, with PostgreSQL and PostGIS. Pipelines, the database and the web apps all run on that machine, and a static app is just a set of files served by the same server. If OpenHEXA becomes the workhorse of a large team, and the pipelines need more compute and memory than one machine can provide, it can also be deployed on Kubernetes and scaled as needed. This has already been done for large UN organizations. Another option is to have Bluesquare host OpenHEXA and take care of it, for teams that would rather not run the server themselves. The pipelines, web apps and AI tools work the same way in every setup.
AI tools are only involved when someone builds or changes an app. They write the app’s code, through the built-in assistant or an external agent connected over MCP. Serving the dashboards to users depends on nothing outside the server that hosts OpenHEXA. For a ministry with a limited IT budget that runs its own server, this means dashboards get built in days instead of weeks, and the running cost is one server with no BI license per user and no separate cloud hosting. A recent example in the DRC shows how quickly a ministry team can get there.
During the Ebola response in the DRC, case data is collected in DHIS2 Tracker and visualized in a dedicated Apache Superset BI dashboard. In practice, however, DHIS2 data was not timely enough to support daily contact tracing. To fill the gap, the Ministry of Health (MoH) set up temporary Excel files to identify the health zones where contact tracing needed to be reinforced.
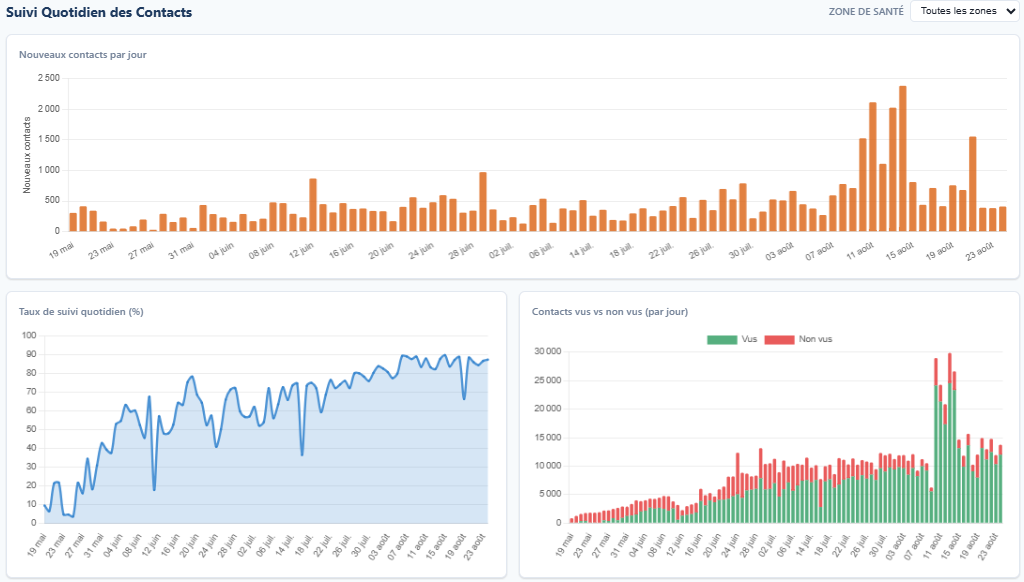
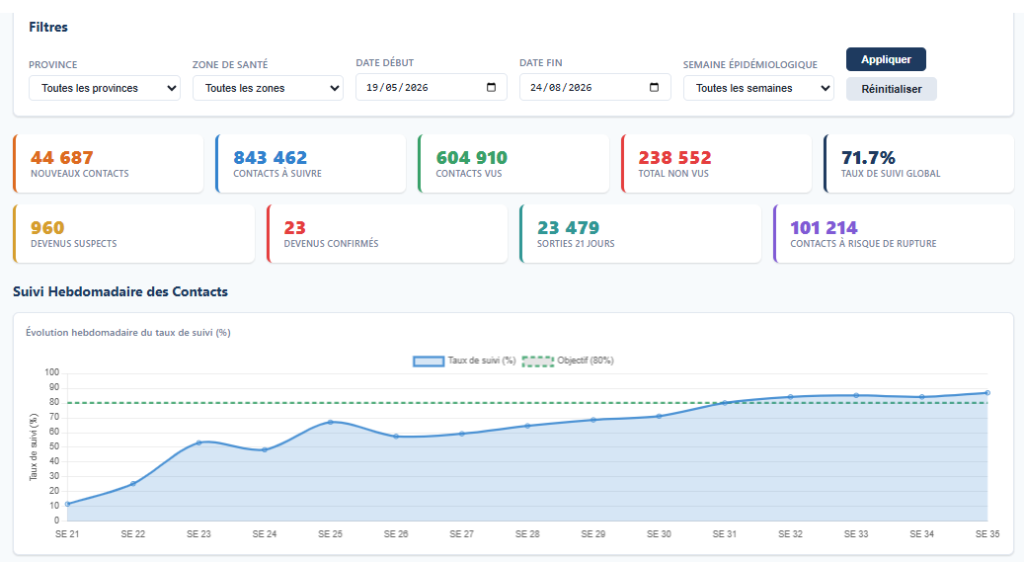
These Excel files gave the most up-to-date picture of the response, but no analytical product was built on them to support data-driven decisions. MoH data managers with no coding skills used the AI features of OpenHEXA to build an ETL pipeline that cleans the files. It corrects date formats, fixes misspelled province names and resolves mismatches with the health pyramid. They then used the AI features of the OpenHEXA Web App to build a contact-tracing dashboard. Within an hour and a few iterations, the MoH had a working operational dashboard. It flagged the health zones where contact listing and follow-up needed to improve, and these findings were reported to the relevant response pillars. The dashboard is now used to track KPIs at the daily surveillance meeting in Bunia.
The example offers three lessons:
You can try it now: get started for free and get access to the platform immediately, with a 30-day free trial, or request a demo.